Dashboard
The Dashboard is the main page of DHIS2 Audit Vision. It provides a consolidated and visual view of the audit activities in your DHIS2 system.
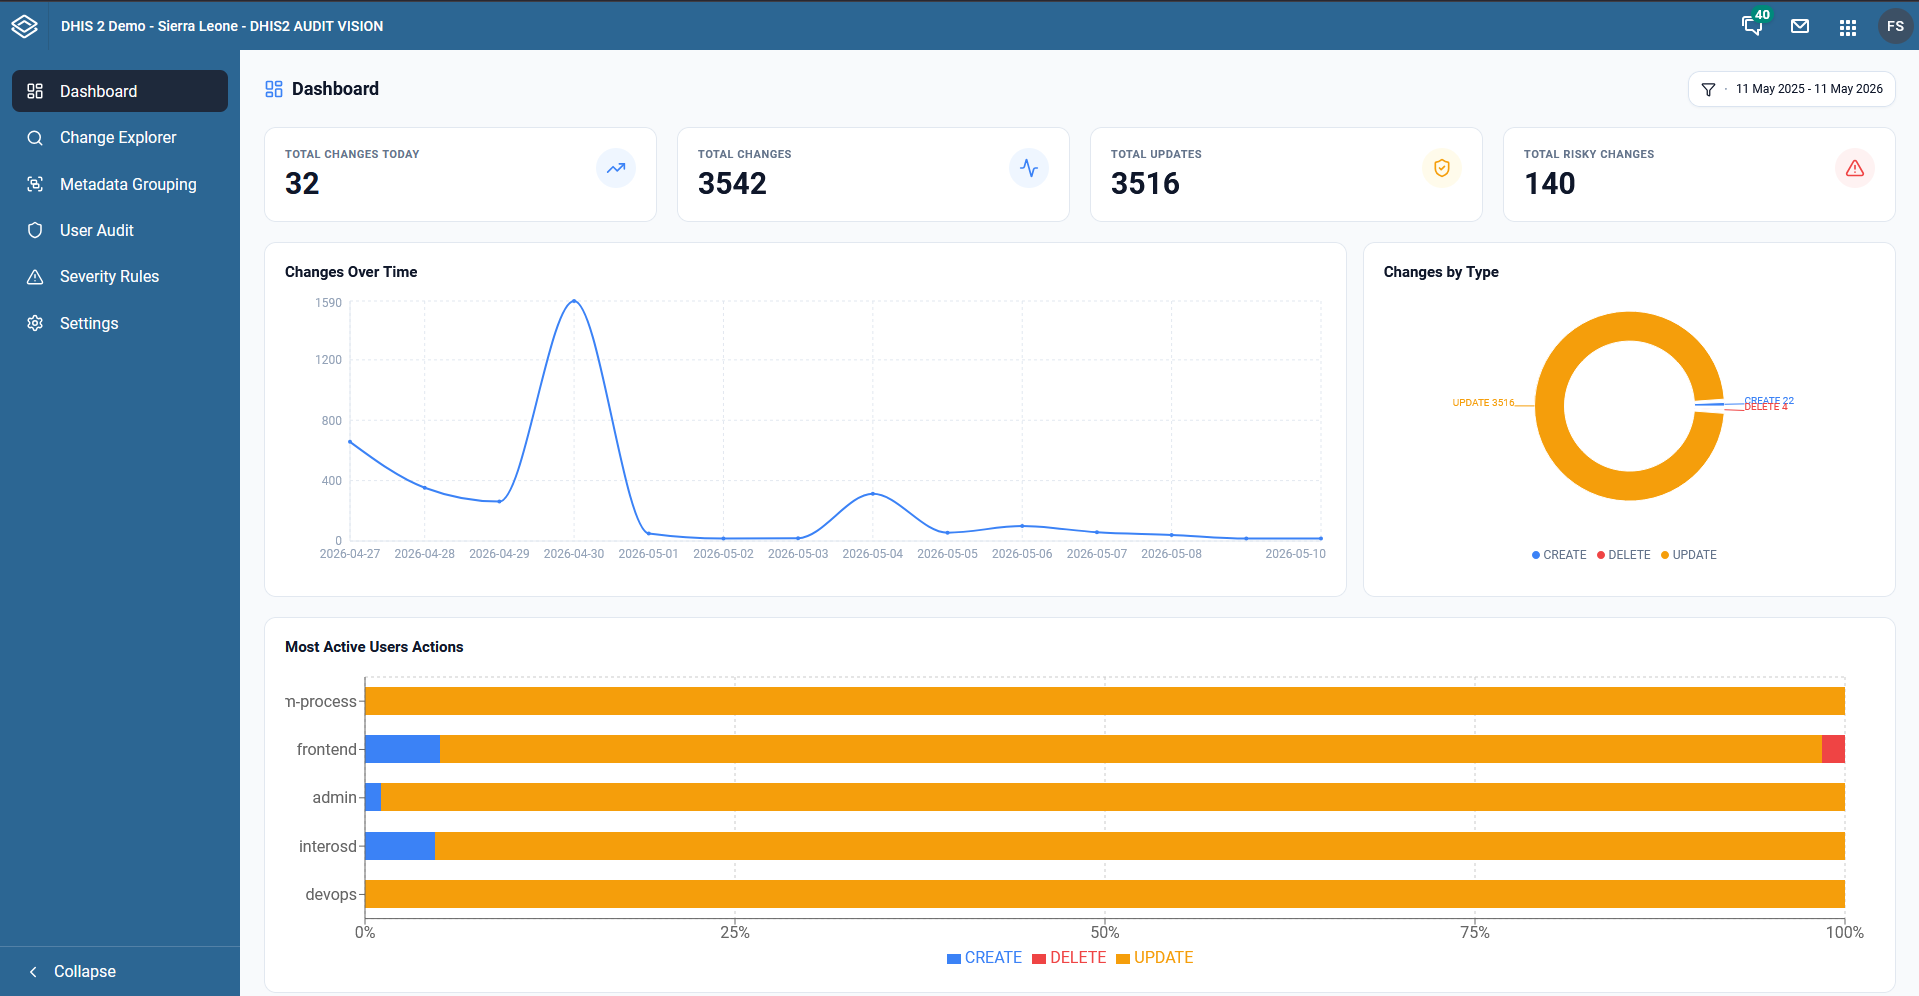
Below we explain each of the main aspects visible on the dashboard:
1. Summary Indicators (KPIs)
At the top of the page, you will find four main cards with critical metrics:
- Total Changes Today: Shows the total number of changes recorded on the current day. The trend icon indicates whether activity is increasing or decreasing compared to the previous period.
- Total Changes: The total historical volume of changes processed by the system.
- Total Updates: Specifically the number of update operations (modifications to existing records).
- Total Risky Changes: Identifies changes that triggered high-severity rules, allowing for immediate focus on potential issues.
2. Trends Graph (Changes Over Time)
This line graph shows the evolution of changes over time. It is ideal for identifying abnormal spikes in activity on specific dates, which may indicate data migrations, system errors, or unusual user activity.
3. Changes by Type
The donut chart provides a percentage distribution of operations:
- CREATE: New data or metadata entries.
- UPDATE: Modifications to existing records.
- DELETE: Removal of data or metadata.
4. Most Active Users Actions
This horizontal bar chart highlights the users (or system processes like frontend, admin, devops) that are generating the most activity. Each bar is segmented by action type (Create, Update, Delete), allowing you to see not only who is most active but also what type of work they are performing.
5. Global Filters
In the top right corner, there is a date picker and filters that allow you to adjust all dashboard data for a specific period, facilitating retrospective audits.